In mathematics, the slope or gradient of a line describes its steepness, incline, or grade. A higher slope value indicates a steeper incline.
The slope is defined as the ratio of the "rise" divided by the "run" between two points on a line, or in other words, the ratio of the altitude change to the horizontal distance between any two points on the line. Given two points (x1,y1) and (x2,y2) on a line, the slope m of the line is

Through differential calculus, one can calculate the slope of the tangent line to a curve at a point.
The concept of slope applies directly to grades or gradients in geography and civil engineering. Through trigonometry, the grade m of a road is related to its angle of incline θ by
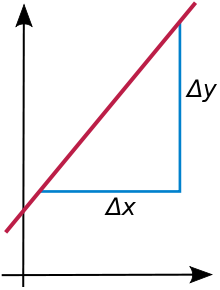
The slope of afined as the rise over the run, m = Δy/Δx.
The slope of a line in the plane containing the x and y axes is generally represented by the letter m, and is defined as the change in the y coordinate divided by the corresponding change in the x coordinate, between two distinct points on the line. This is described by the following equation:

(The delta symbol, "Δ", is commonly used in mathematics to mean "difference" or "change".)
Given two points (x1,y1) and (x2,y2), the change in x from one to the other is x2 − x1 (run), while the change in y is y2 − y1 (rise). Substituting both quantities into the above equation obtains the following:

Slope illustrated for y = (3/2)x − 1.
Suppose a line runs through two points: P = (1, 2) and Q = (13, 8). By dividing the difference in y-coordinates by the difference in x-coordinates, one can obtain the slope of the line:

The slope is 0.5.
As another example, consider a line which runs through the points (4, 15) and (3, 21). Then, the slope of the line is

Using Slope and y-Intercept to Graph Lines
Given two points (x1, y1) and (x2, y2), the formula for the slope of the straight line going through these two points is:

...where the subscripts merely indicate that you have a "first" point (whose coordinates are subscripted with a "1") and a "second" point (whose coordinates are subscripted with a "2"); that is, the subscripts indicate nothing more than the fact that you have two points to work with. Note that the point you pick as the "first" one is irrelevant; if you pick the other point to be "first", then you get the same value for the slope:

The formula for slope is sometimes referred to as "rise over run", because the fraction consists of the "rise" (the change in y, going up or down) divided by the "run" (the change in x, going from left to the right). If you've ever done roofing, built a staircase, graded landscaping, or installed gutters or outflow piping, you've probably encountered this "rise over run" concept. The point is that slope tells you how much y is changing for every so much that x is changing. Pictures can be helpful, so let's look at the line y = ( 2/3 )x – 4; we'll compute the slope, and draw the line.
To find points from the line equation, we have to pick values for one of the variables, and then compute the corresponding value of the other variable. If, say, x = –3, then y = ( 2/3 )(–3) – 4 = –2 – 4 = –6, so the point (–3, –6) is on the line. If x = 0, then y = ( 2/3 )(0) – 4 = 0 – 4 = –4, so the point (0, –4) is on the line. Now that we have two points on the line, we can find the slope of that line from the slope formula:

Let's look at these two points on the graph:
In stair-stepping up from the first point to the second point, our "path" can be viewed as forming a right triangle:

The distance between the y-values of the two points (that is, the height of the triangle) is the "y2 – y1" part of the slope formula. The distance between the x-values (that is, the length of the triangle) is the "x2 – x1" part of the slope formula. Note that the slope is 2/3, or "two over three". To go from the first point to the second, we went "two up and three over". This relationship between the slope of a line and pairs of points on that line is always true.

To get to the "next" point, we can go up another two (to y = –2), and over to the right another three (to x = 3):
With these three points, we can graph the line y = ( 2/3 )x – 4.
Let's try another line equation: y = –2x + 3. We've learned that the number on x is the slope, so m
= –2 for this line. If, say, x = 0, then y = –2(0) + 3 = 0 + 3 = 3. Then the point (0, 3) is on the line. With this information, we can find more points on the line. First, though, you might want to convert the slope value to fractional form, so you can more easily do the "up and over" thing. Any number is a fraction if you put it over "1", so, in this case, it is more useful to say that the slope is m = –2/1. That means that we will be going "down two and over one" for each new point.We'll start at the point we found above, and then go down two and over one to get to the next point:

Go down another two, and over another one, to get to the "next" point on y = –2x + 3:

Given a point on the line, you can use the slope to get to the "next" point by counting "so many up or down, and then so many over to the right". But how do you find your first point? Take a look back at the graph of the first line and its equation: y = ( 2/3 )x – 4 crossed the y-axis at y = –4, so the equation gave us the y-intercept. The second line did too: the graph of y = –2x + 3 crossed the y-axis at y = 3. This relationship always holds true: in y = mx + b, "b" gives the y-intercept, and "m" is the slope. We can use this fact to easily graph straight lines:
Graph the equation y = ( 3/5 ) x – 2 from the slope and y-intercept.
From the equation, I know that the slope is m = 3/5, and that the line crosses the y-axis at
y = –2.
I'll start by plotting this first point:

From this point, I go up three and over five:

Then I go up another three and over another five to get my third point:

With three points, I can draw my line:

Reference:
http://en.wikipedia.org/wiki/Slope
http://www.purplemath.com/modules/slopgrph2.htm
No comments:
Post a Comment